1
2
3
4
5
6
7
# load the data
import pandas as pd
import matplotlib.pyplot as plt
import numpy as np

X = pd.read_csv("data/train.csv")
X_test = pd.read_csv("data/test.csv")

1
X.describe()

PassengerId Survived Pclass Age SibSp Parch Fare
count 891.000000 891.000000 891.000000 714.000000 891.000000 891.000000 891.000000
mean 446.000000 0.383838 2.308642 29.699118 0.523008 0.381594 32.204208
std 257.353842 0.486592 0.836071 14.526497 1.102743 0.806057 49.693429
min 1.000000 0.000000 1.000000 0.420000 0.000000 0.000000 0.000000
25% 223.500000 0.000000 2.000000 20.125000 0.000000 0.000000 7.910400
50% 446.000000 0.000000 3.000000 28.000000 0.000000 0.000000 14.454200
75% 668.500000 1.000000 3.000000 38.000000 1.000000 0.000000 31.000000
max 891.000000 1.000000 3.000000 80.000000 8.000000 6.000000 512.329200

1
2
3
4
# check null values

null_columns=X.columns[X.isnull().any()]
X.isnull().sum()

1
2
3
4
5
6
7
8
9
10
11
12
13
    PassengerId      0
    Survived         0
    Pclass           0
    Name             0
    Sex              0
    Age            177
    SibSp            0
    Parch            0
    Ticket           0
    Fare             0
    Cabin          687
    Embarked         2
    dtype: int64

1
2
3
4
5
6
7
8
9
10
11
12
13
14
15
16
17
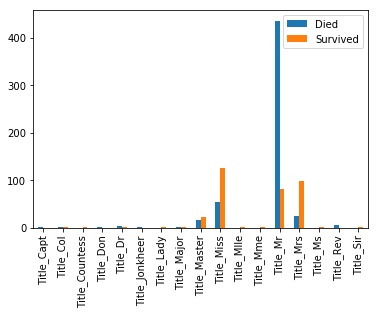
# title from name looks interesting because you can get if the person is married or not and guess their age if it is not known

import re

#A function to get the title from a name.
def get_title(name):
    # Use a regular expression to search for a title.  Titles always consist of capital and lowercase letters, and end with a period.
    title_search = re.search(' ([A-Za-z]+)\.', name)
    #If the title exists, extract and return it.
    if title_search:
        return title_search.group(1)
    return ""

X["Title"] = X["Name"].apply(get_title)
X_test["Title"] = X_test["Name"].apply(get_title)

X["Title"].value_counts()

1
2
3
4
5
6
7
8
9
10
11
12
13
14
15
16
17
18
    Mr          517
    Miss        182
    Mrs         125
    Master       40
    Dr            7
    Rev           6
    Major         2
    Col           2
    Mlle          2
    Mme           1
    Sir           1
    Capt          1
    Lady          1
    Don           1
    Ms            1
    Countess      1
    Jonkheer      1
    Name: Title, dtype: int64

1
2
3
4
5
6
7
8
# We can see here that most people with Mr in their title died while Miss and Mrs survived

title_survive = X[["Title", "Survived"]]
title_survive_transformed = pd.get_dummies(title_survive, columns=["Title"])

bar = title_survive_transformed.groupby("Survived").apply(lambda column: column.sum()).transpose().drop(["Survived"])
bar.columns = ["Died","Survived"]
bar.plot.bar()

1
2
3
4
5
6
7
8
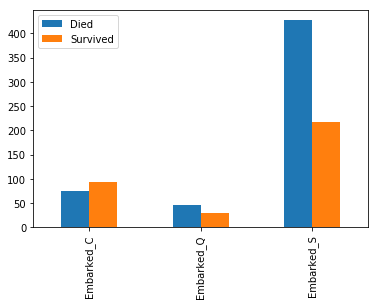
# you can see that you had a greater chance to survive if you were in embarked C or Q

embarked_survive = X[["Survived", "Embarked"]]
embarked_survive_transformed = pd.get_dummies(embarked_survive, columns=["Embarked"])

e_bar = embarked_survive_transformed.groupby("Survived").apply(lambda column: column.sum()).transpose().drop(["Survived"])
e_bar.columns = ["Died","Survived"]
e_bar.plot.bar()

1
2
3
4
5
6
7
8
9
10
11
12
13
14
15
X["FamilySize"] = 1 + X["SibSp"] + X["Parch"]
X_test["FamilySize"] = 1 + X_test["SibSp"] + X_test["Parch"]
family_size = X["FamilySize"].apply(lambda row: "Single" if row == 1 else ("Large" if row < 5 else "Extreme"))     
family_size_test = X_test["FamilySize"].apply(lambda row: "Single" if row == 1 else ("Large" if row < 5 else "Extreme"))     
X["FamilySize"] = family_size

family_size = pd.DataFrame(family_size)
family_size["Survived"] = X["Survived"]
family_size_transformed = pd.get_dummies(family_size, columns=["FamilySize"])

X_test["FamilySize"] = family_size_test

f_bar = family_size_transformed.groupby("Survived").apply(lambda column: column.sum()).transpose().drop(["Survived"])
f_bar.columns = ["Died","Survived"]
f_bar.plot.bar()

1
2
3
4
5
# fill NaN values with mean so that we can do transformations

X.fillna(X.mean(), inplace=True)
X_test.fillna(X_test.mean(), inplace=True)
X.head()

PassengerId Survived Pclass Name Sex Age SibSp Parch Ticket Fare Cabin Embarked Title FamilySize
0 1 0 3 Braund, Mr. Owen Harris male -0.592481 1 0 A/5 21171 -0.502445 NaN S Mr Large
1 2 1 1 Cumings, Mrs. John Bradley (Florence Briggs Th... female 0.638789 1 0 PC 17599 0.786845 C85 C Mrs Large
2 3 1 3 Heikkinen, Miss. Laina female -0.284663 0 0 STON/O2. 3101282 -0.488854 NaN S Miss Single
3 4 1 1 Futrelle, Mrs. Jacques Heath (Lily May Peel) female 0.407926 1 0 113803 0.420730 C123 S Mrs Large
4 5 0 3 Allen, Mr. William Henry male 0.407926 0 0 373450 -0.486337 NaN S Mr Single
1
2
3
4
5
6
7
8
9
# Age and Fares are on different scales, so let's scale them

from sklearn import preprocessing

std_scale = preprocessing.StandardScaler().fit_transform(X[['Age', 'Fare']])
X[["Age", "Fare"]] = std_scale
std_scale_test = preprocessing.StandardScaler().fit_transform(X_test[['Age', 'Fare']])
X_test[["Age", "Fare"]] = std_scale_test
std_scale

array([[ -5.92480600e-01, -5.02445171e-01], [ 6.38789012e-01, 7.86845294e-01], [ -2.84663197e-01, -4.88854258e-01], ..., [ -2.23290646e-16, -1.76263239e-01], [ -2.84663197e-01, -4.43810379e-02], [ 1.77062908e-01, -4.92377828e-01]]) unknown type
1
2
3
4
# transform form categorical to numerical

X_transformed = pd.get_dummies(X, columns = ["Sex", "FamilySize", "Cabin", "Title", "Embarked"])
X_test_transformed = pd.get_dummies(X_test, columns = ["Sex", "FamilySize", "Cabin", "Title", "Embarked"])

1
X_transformed.head()

PassengerId Survived Pclass Name Age SibSp Parch Ticket Fare Sex_female ... Title_Mlle Title_Mme Title_Mr Title_Mrs Title_Ms Title_Rev Title_Sir Embarked_C Embarked_Q Embarked_S
0 1 0 3 Braund, Mr. Owen Harris -0.592481 1 0 A/5 21171 -0.502445 0 ... 0 0 1 0 0 0 0 0 0 1
1 2 1 1 Cumings, Mrs. John Bradley (Florence Briggs Th... 0.638789 1 0 PC 17599 0.786845 1 ... 0 0 0 1 0 0 0 1 0 0
2 3 1 3 Heikkinen, Miss. Laina -0.284663 0 0 STON/O2. 3101282 -0.488854 1 ... 0 0 0 0 0 0 0 0 0 1
3 4 1 1 Futrelle, Mrs. Jacques Heath (Lily May Peel) 0.407926 1 0 113803 0.420730 1 ... 0 0 0 1 0 0 0 0 0 1
4 5 0 3 Allen, Mr. William Henry 0.407926 0 0 373450 -0.486337 0 ... 0 0 1 0 0 0 0 0 0 1

5 rows × 181 columns

1
2
3
4
# correlations

corr_matrix = X_transformed.corr()
corr_matrix["Survived"].sort_values(ascending=False)

1
2
3
4
5
6
7
8
9
10
11
12
13
14
15
16
17
18
19
20
21
22
23
24
25
26
27
28
29
30
31
32
33
34
35
36
37
38
39
40
41
42
43
44
45
46
47
48
49
50
51
52
53
54
55
56
57
58
59
60
61
62
    Survived                 1.000000
    Sex_female               0.543351
    Title_Mrs                0.339040
    Title_Miss               0.327093
    FamilySize_Large         0.279855
    Fare                     0.257307
    Embarked_C               0.168240
    Title_Master             0.085221
    Cabin_B96 B98            0.085083
    Parch                    0.081629
    Cabin_F33                0.073642
    Cabin_E101               0.073642
    Cabin_C52                0.060095
    Cabin_D33                0.060095
    Cabin_B28                0.060095
    Cabin_E33                0.060095
    Cabin_F4                 0.060095
    Cabin_D36                0.060095
    Cabin_C93                0.060095
    Cabin_D35                0.060095
    Cabin_B77                0.060095
    Cabin_C125               0.060095
    Cabin_B49                0.060095
    Cabin_B57 B59 B63 B66    0.060095
    Cabin_B18                0.060095
    Cabin_B35                0.060095
    Cabin_C92                0.060095
    Cabin_D20                0.060095
    Cabin_E25                0.060095
    Title_Mlle               0.060095
                               ...   
    Cabin_C86               -0.026456
    Cabin_A10               -0.026456
    Cabin_D50               -0.026456
    Cabin_D48               -0.026456
    Cabin_E58               -0.026456
    Cabin_B71               -0.026456
    Cabin_F G63             -0.026456
    Cabin_C46               -0.026456
    Cabin_D30               -0.026456
    Title_Capt              -0.026456
    Cabin_E77               -0.026456
    Cabin_F38               -0.026456
    Cabin_D6                -0.026456
    Cabin_B82 B84           -0.026456
    Cabin_A36               -0.026456
    Cabin_B102              -0.026456
    Title_Jonkheer          -0.026456
    Cabin_A24               -0.026456
    SibSp                   -0.035322
    Cabin_D26               -0.037436
    Cabin_C124              -0.037436
    Cabin_F G73             -0.037436
    Title_Rev               -0.064988
    Age                     -0.069809
    FamilySize_Extreme      -0.125147
    Embarked_S              -0.155660
    FamilySize_Single       -0.203367
    Pclass                  -0.338481
    Sex_male                -0.543351
    Title_Mr                -0.549199
    Name: Survived, Length: 179, dtype: float64

1
2
3
4
5
# remove columns that offer little help and the labels

y = X_transformed["Survived"]
X_fewer_columns = X_transformed.drop(["Survived", "Name", "Ticket", "PassengerId"], axis=1).copy()
X_test_fewer_columns = X_test_transformed.drop(["Name", "Ticket", "PassengerId"], axis=1).copy()

1
2
3
4
5
6
7
8
# Stochastic Gradient Descent Classifier

from sklearn.linear_model import SGDClassifier

sgd_clf = SGDClassifier(random_state=42)
X_matrix = X_fewer_columns.as_matrix()
y_matrix = y.as_matrix()
sgd_clf.fit(X_matrix, y_matrix)

1
2
3
4
5
6
7
8
9
10
11
12
13
14
15
16
17
18
19
20
21
22
23
24
25
26
27
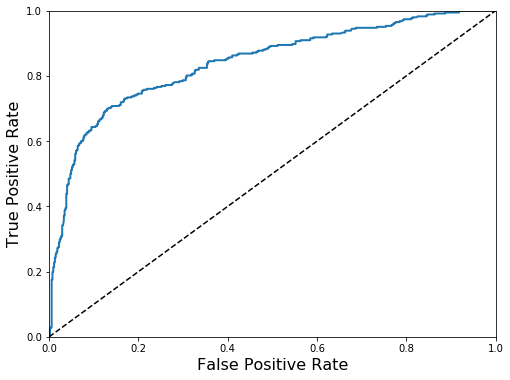
# display all scores in one go

from sklearn.model_selection import cross_val_predict
from sklearn.metrics import confusion_matrix
from sklearn.metrics import precision_score, recall_score
from sklearn.metrics import f1_score
from sklearn.metrics import roc_curve

def plot_roc_curve(fpr, tpr, **options):
    plt.plot(fpr, tpr, linewidth=2, **options)
    plt.plot([0, 1], [0, 1], 'k--')
    plt.axis([0, 1, 0, 1])
    plt.xlabel('False Positive Rate', fontsize=16)
    plt.ylabel('True Positive Rate', fontsize=16)

def display_all_scores(model, X):
    y_train_predictions = cross_val_predict(model, X, y_matrix, cv = 3)
    print("Scores for model:",model.__class__.__name__)
    print("Confusion metrics:", confusion_matrix(y_matrix, y_train_predictions))
    print("Precision score:", precision_score(y_matrix, y_train_predictions))
    print("Recall score:", recall_score(y_matrix, y_train_predictions))
    print("F1 score:", f1_score(y_matrix, y_train_predictions))
    y_scores = cross_val_predict(model, X, y_matrix, cv = 3, method="decision_function")
    fpr, tpr, thresholds = roc_curve(y, y_scores)
    plt.figure(figsize=(8, 6))
    plot_roc_curve(fpr, tpr)
    plt.show()

1
display_all_scores(sgd_clf, X_matrix)

1
2
3
4
5
6
    Scores for model: SGDClassifier
    Confusion metrics: [[354 195]
     [ 98 244]]
    Precision score: 0.555808656036
    Recall score: 0.713450292398
    F1 score: 0.624839948784

1
2
3
4
5
6
7
8
9
10
11
12
13
14
15
16
17
# let's see how we do if we remove more columns that do not look interesting

remove_some_cabins = [c for c in X_fewer_columns.columns
                      if c[:6] != "Cabin_"
                      and c != "Parch"
                      and c != "SibSp"
                      and c != "Title_Major"
                      and c != "Title_Rev"
                      and c != "Title_Sir"
                      and c != "Title_Jonkheer"
                      and c != "Title_Dr"
                      and c != "Title_Don"
                      and c != "Title_Countess"
                      and c != "Title_Col"
                      and c != "Title_Capt"
                      ]    
X_even_fewer_columns = X_fewer_columns[remove_some_cabins]

1
2
3
4
sgd_clf1 = SGDClassifier(random_state=42)
X_matrix = X_even_fewer_columns.as_matrix()
y_matrix = y.as_matrix()
sgd_clf1.fit(X_matrix, y_matrix)

1
2
3
# As you can see this score is worse then the previous one

display_all_scores(sgd_clf1, X_matrix)

1
2
3
4
5
6
    Scores for model: SGDClassifier
    Confusion metrics: [[504  45]
     [130 212]]
    Precision score: 0.824902723735
    Recall score: 0.619883040936
    F1 score: 0.707846410684

1
2
3
4
5
6
7
8
9
10
11
12
13
# Let's check the Random Forest and you can see that it fares better

from sklearn.ensemble import RandomForestClassifier
from sklearn.model_selection import cross_val_predict
from sklearn.model_selection import cross_val_score

X_matrix = X_fewer_columns.as_matrix()
rf = RandomForestClassifier(n_jobs=2)
rf.fit(X_matrix, y_matrix)

y_train_predictions = cross_val_predict(rf, X_matrix,y_matrix,cv=3)
scores = cross_val_score(rf, X_matrix, y_matrix, scoring='f1', cv=3)
print("F1 score for Random Forest", scores.mean())

F1 score for Random Forest 0.727883412153
1
2
3
4
5
6
7
8
9
10
11
12
13
14
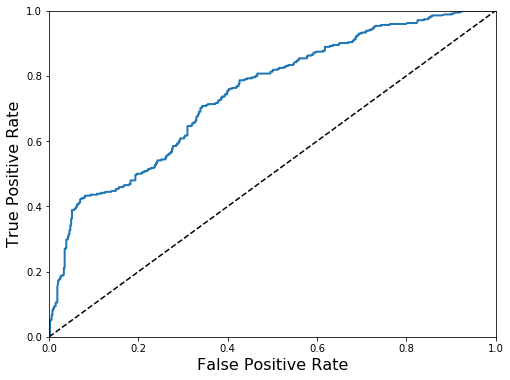
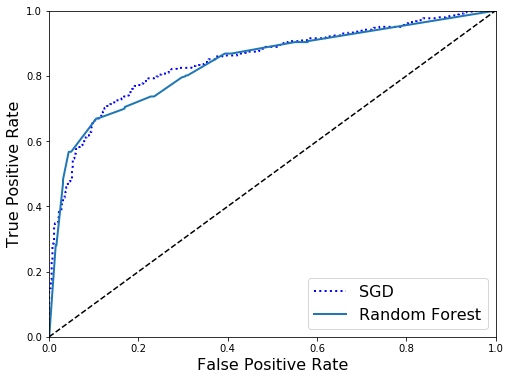
# ROC Curve for SGD vs RFC, showing that they perform about the same

y_probas_forest = cross_val_predict(rf, X_matrix, y_matrix, cv=3, method="predict_proba")
y_scores_forest = y_probas_forest[:, 1] # score = proba of positive class
fpr_forest, tpr_forest, thresholds_forest = roc_curve(y_matrix, y_scores_forest)

y_scores_sgd = cross_val_predict(sgd_clf, X_matrix, y_matrix, cv = 3, method="decision_function")
fpr, tpr, thresholds = roc_curve(y, y_scores_sgd)

plt.figure(figsize=(8, 6))
plt.plot(fpr, tpr, "b:", linewidth=2, label="SGD")
plot_roc_curve(fpr_forest, tpr_forest, label="Random Forest")
plt.legend(loc="lower right", fontsize=16)
plt.show()

1
2
3
4
5
6
7
8
9
10
11
12
13
14
15
16
17
18
19
20
21
22
23
24
25
26
27
28
29
30
31
# Let's see how it performs on the test sample

# make the columns equal in number
for column in X_fewer_columns.columns:
    if column not in X_test_fewer_columns.columns:
        X_test_fewer_columns[column] = 0

for column in X_test_fewer_columns.columns:
    if column not in X_fewer_columns.columns:
        X_test_fewer_columns.drop([column], axis=1, inplace=True)


X_test_matrix = X_test_fewer_columns.as_matrix()
test_predictions = rf.predict(X_test_matrix)
test_predictions_sgd = sgd_clf.predict(X_test_matrix)

submission = pd.DataFrame(
    {
        "PassengerId": X_test["PassengerId"],
        "Survived": test_predictions
    }
)
submission_sgd = pd.DataFrame(
    {
        "PassengerId": X_test["PassengerId"],
        "Survived": test_predictions_sgd
    }
)

submission.to_csv("data/titanic_submission.csv", index=False) # both score about 0.72
submission_sgd.to_csv("data/titanic_submission_sgd.csv", index=False)