# merge rankings with players but keep only top 100
ranks=readAllFiles()ranks=ranks[(ranks['ranking']<100)]ranks['player_id']=ranks['player_id'].apply(lambdarow:int(row))players=readPlayers()players=ranks.merge(players,right_on="player_id",left_on="player_id")players.head()
ranking_date
ranking
player_id
ranking_points
first_name
last_name
hand
birth_date
country_code
0
2000-01-10
1
101736
4135
Andre
Agassi
R
1970-04-29
USA
1
2000-01-17
1
101736
4135
Andre
Agassi
R
1970-04-29
USA
2
2000-01-31
1
101736
5045
Andre
Agassi
R
1970-04-29
USA
3
2000-02-07
1
101736
5045
Andre
Agassi
R
1970-04-29
USA
4
2000-02-14
1
101736
5045
Andre
Agassi
R
1970-04-29
USA
1
2
3
4
5
6
7
# we are interested in ranking date, country code and counting the number of players.
# To keep the data cleaner get only countries with at least 4 players in top 100
aggregate=players[["ranking_date","country_code"]].groupby(["ranking_date","country_code"]).size().to_frame()aggregate=pd.DataFrame(aggregate.to_records())# transform the series to df
aggregate_least_4=aggregate[(aggregate["0"]>3)]aggregate_least_10=aggregate[(aggregate["0"]>9)]
1
2
3
4
5
6
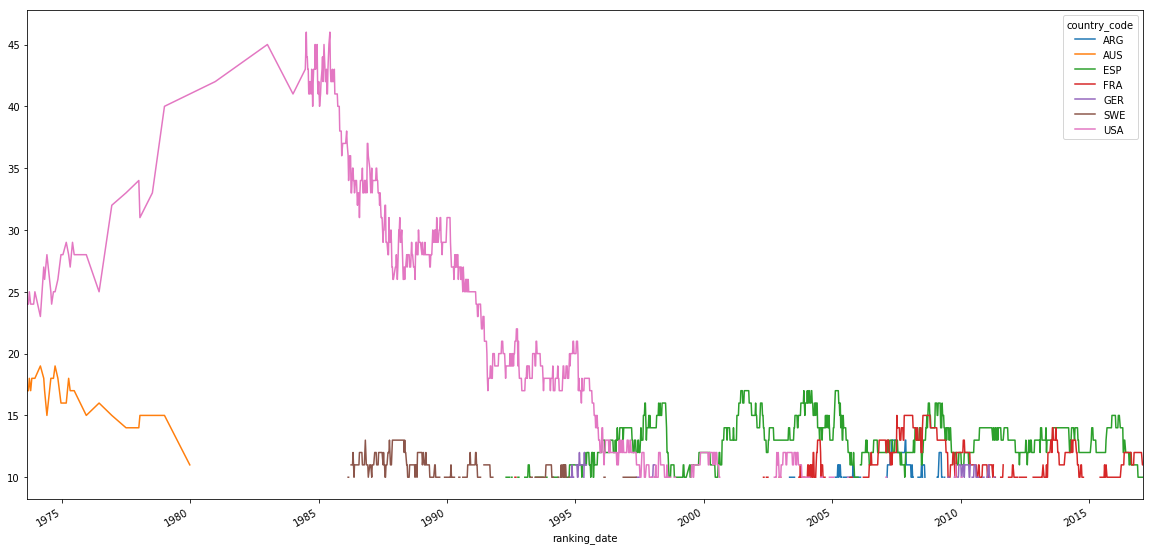
# countries with at least 10 players in top 10 at a given time.
# we can see that the US has dominated until 1997, when Spain started to take the lead.
# Since 2000, Spain and France had the most players in top 100.
pivoted=pd.pivot_table(aggregate_least_10,values='0',columns='country_code',index="ranking_date")pivoted.plot(figsize=(20,10))
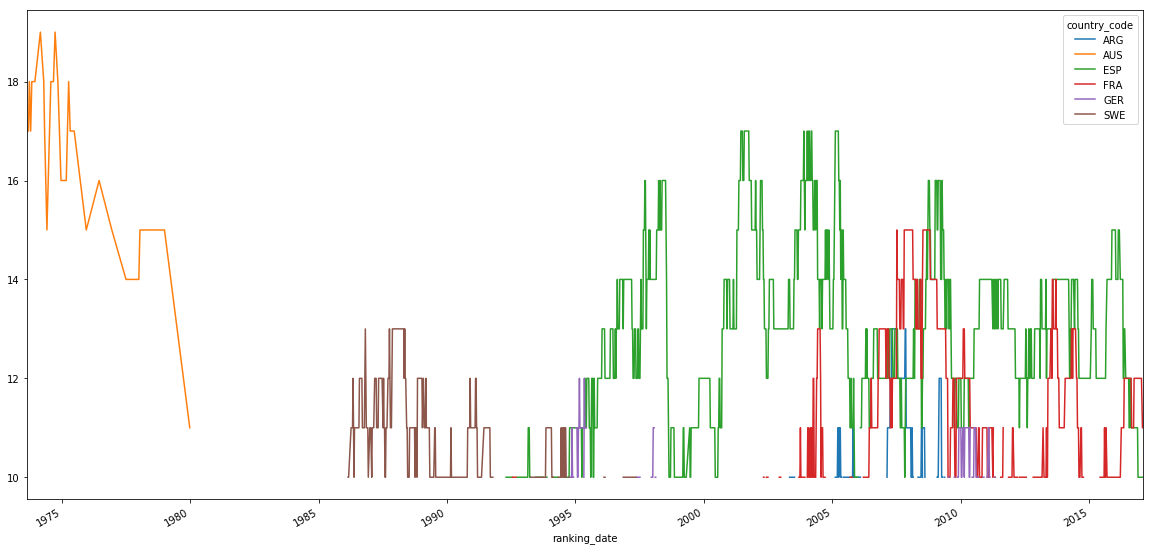
Without the outlier USA we get a better image.
Show the code
1
2
3
4
5
# Let's see that figure again without the outlier USA
aggregate_no_usa=aggregate[(aggregate["country_code"]!="USA")&(aggregate["0"]>9)]pivoted=pd.pivot_table(aggregate_no_usa,values='0',columns='country_code',index="ranking_date")pivoted.plot(figsize=(20,10))
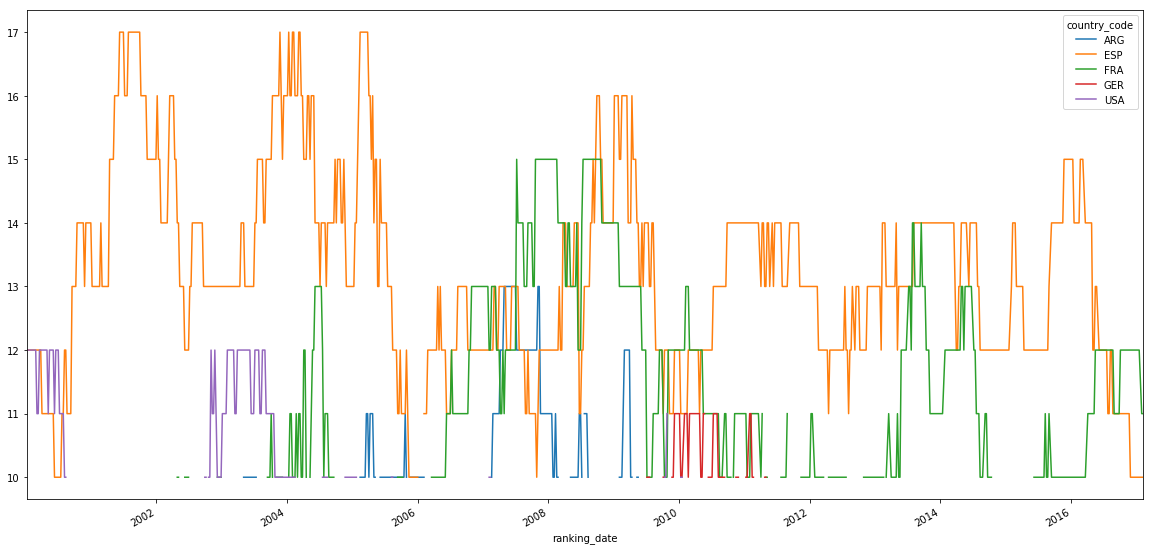
Le'ts see after 2000 a close-up of France and Spain's dominance:
Show the code
1
2
3
4
5
# after 2000 Spain and France dominate with an average of 15 players in top 100
aggregate_after_2000=aggregate[(aggregate["ranking_date"]>"2000-01-01")&(aggregate["0"]>9)]pivoted=pd.pivot_table(aggregate_after_2000,values='0',columns='country_code',index="ranking_date")pivoted.plot(figsize=(20,10))
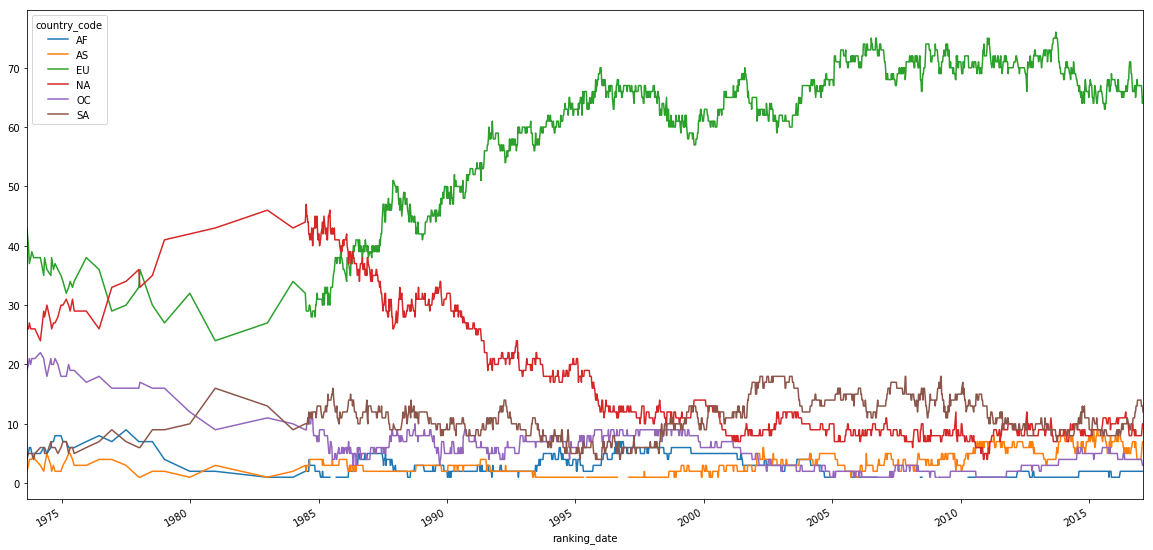
By continent we see that North America dominated in the 80, while Europe has increased it's dominance since the early 90s. Now North America is surpassed by South America and on par with Asia.
Show the code
1
2
3
4
5
6
7
8
# let's see how it fairs by continent
importjsonwithopen('iso3.json')asdata_file:countries=json.load(data_file)withopen('continent.json')asdata_file:continents=json.load(data_file)
1
2
3
4
5
6
7
8
9
10
11
12
13
14
ioc_countries={}forcountryincountries:ifcountry["ioc"]:ioc_countries[country["ioc"]]=country["alpha2"]ioc_countries["YUG"]="MK"aggregate_continents=aggregate.copy()ioc_countriesaggregate_continentsaggregate_continents["country_code"]=aggregate_continents["country_code"].apply(lambdarow:continents[ioc_countries[row]])aggregate_continents=aggregate_continents[["ranking_date","country_code","0"]].groupby(["ranking_date","country_code"]).sum()aggregate_continents=pd.DataFrame(aggregate_continents.to_records())# transform the series to df
pivoted=pd.pivot_table(aggregate_continents,values='0',columns='country_code',index="ranking_date")pivoted.plot(figsize=(20,10))